[ Data ] · 7 min read
LLM Hallucination Rates: 3.3% to 88%, Depending on the Job
Every article quoting a single LLM hallucination rate is quoting one benchmark on one task. Put six published studies side by side and the rates run from 3.3% to 88% — a spread driven far more by the task than by the model.
Key takeaways
- Published hallucination rates span 3.3% to 88% across six sources — a 30x spread that has almost nothing to do with which model was tested.
- The task type dominates. The best summarisation result (3.3%) and the legal-query range (69–88%) come from the same generation of frontier models.
- Leading a knowledge benchmark does not mean rarely fabricating. Claude Fable 5 tops AA-Omniscience at index 40, seven points clear of Gemini 3.1 Pro at 33 — driven by a record 61% accuracy, while still fabricating 54.9% of the time when it answers something it does not know.
- Prompting moves the number more than model choice does on some tasks. On HALC-Bench, structured mitigation prompting cut the long-context rate from 65.9% to 44.2% — a 21.7-point drop with no model change.
- The widely-repeated "about 30%" figure is not a measurement. Lakera describes it as media shorthand and explicitly not a formal metric.
Ask what an LLM's hallucination rate is and you will get a number. The number will be wrong, not because the underlying study is wrong, but because there is no such thing as a hallucination rate in the abstract — only a rate for a specific task, measured a specific way.
We put six published sources side by side. They span 2024 to 2026, cover summarisation, long-context question answering, open-domain knowledge, clinical work, legal queries and citation retrieval, and they report rates from 3.3% to 88%. The comparison is available as CSV.
The six sources, side by side
The rightmost column is the one most comparisons leave out, and it is the reason we publish a range table rather than a pooled average: these studies do not measure the same thing. A summarisation hallucination rate counts statements unsupported by a source document. A fabrication rate counts wrong answers a model gave when it should have declined. Averaging them would produce a tidy number that means nothing.
| Task type | Reported rate | What was measured | Source | Date |
|---|---|---|---|---|
| Summarisation | 3.3% | Statements unsupported by the source document (HHEM) | Vectara Hallucination Leaderboard | Nov 2025 |
| Open-domain knowledge | 35.9% – 54.9% | Fabrication rate when the model answers without knowing | AA-Omniscience | Jul 2026 |
| Long-context QA | 44.2% – 65.9% | With structured mitigation prompting vs without | HALC-Bench, via AIMultiple | Aug 2026 |
| Legal queries | 69% – 88% | General-purpose models on legal questions | Stanford RegLab, via Seekr | Jun 2026 |
| Clinical case summaries | 80.0% – 82.7% | Worst of six models, long and short cases | Mount Sinai, via Healthcare IT News | Aug 2025 |
| Citation retrieval | 86.6% – 100% | Share of cited papers absent from the source review | Chelli et al., PMC11153973 | 2024 |
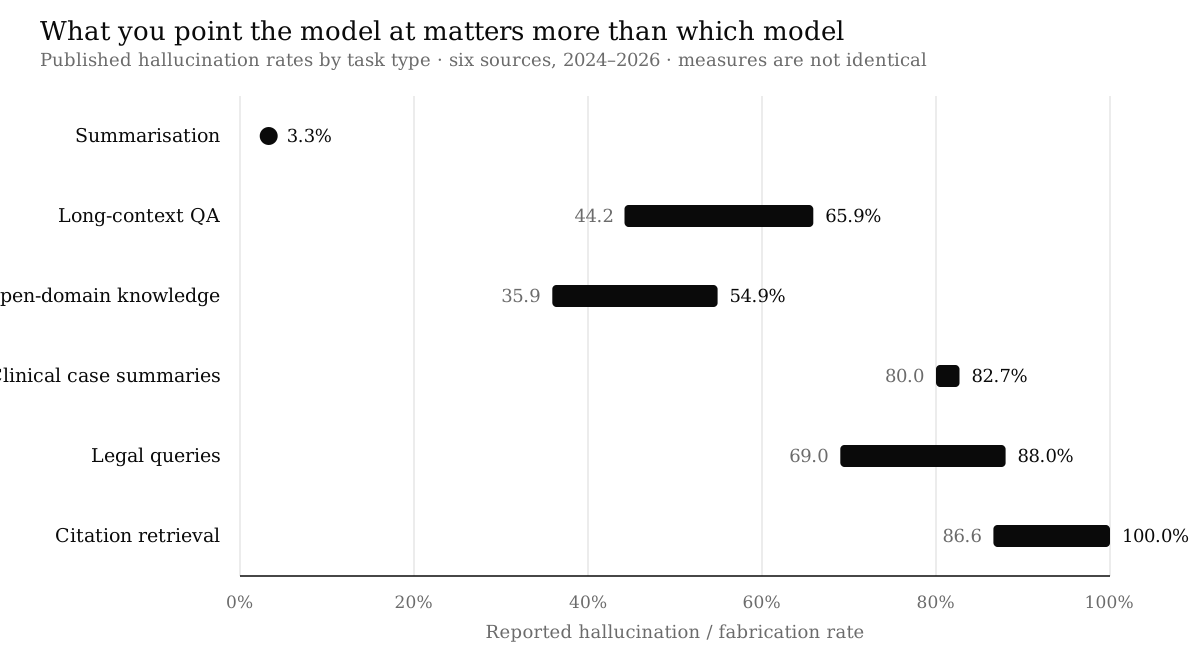
Why summarisation looks solved and legal work does not
The 3.3% figure comes from Vectara's Hallucination Leaderboard, where Gemini-2.5-flash-lite led as of November 2025, with models from Mistral, DeepSeek and IBM Granite close behind. That benchmark gives the model a source document and asks it to summarise. The model does not need to know anything — it needs to not invent.
Stanford's RegLab found general-purpose models hallucinating on 69% to 88% of legal queries in research published across 2024 and 2025. Here the model has no source document. It must retrieve a fact from training, and legal facts are precise, jurisdiction-specific and heavily represented in plausible-sounding but wrong forms.
That is the whole pattern in two rows. Grounded tasks with a document in front of the model produce low rates. Ungrounded recall of precise facts produces high ones. The engineering implication is the argument for retrieval-augmented generation, and it is a stronger argument than the model leaderboards make it look, because it changes which row of this table you are operating in.
The knowledge-benchmark leader still fabricates half the time
AA-Omniscience scores models from −100 to +100, rewarding correct answers, penalising hallucinations, and applying no penalty for declining to answer. A score of 0 means as many correct answers as fabrications.
As of July 2026, Claude Fable 5 leads at index 40 — seven points clear of Gemini 3.1 Pro at 33. The interesting part is what drives that lead. It is not restraint. Fable 5 posts a record 61% accuracy, and still fabricates 54.9% of the time when it answers a question it does not know the answer to. For comparison, Claude Opus 4.8 sits at 35.9% on the same measure.
So the model at the top of a hallucination-aware leaderboard is the one that knows the most, not the one that makes things up least. If your use case punishes confident errors more than it rewards coverage, the leaderboard order is not the order you want.
Prompting moved the number 21.7 points without changing the model
HALC-Bench, reported by AIMultiple in August 2026, found an overall long-context hallucination rate of 65.9% without mitigation prompting, dropping to 44.2% with structured mitigation prompting. Same models, same tasks, 21.7 percentage points of difference from prompt structure alone.
That is larger than most model-to-model gaps in the same table. It is also the cheapest intervention available — which is why we treat prompt structure and retrieval design as part of the build rather than something to tune afterwards on an AI automation project.
The "30% of AI outputs are wrong" figure is not a measurement
A figure of roughly 30% circulates widely as though it were a benchmark result. Lakera's guide describes it plainly as media shorthand suggesting roughly 30% of AI outputs may contain errors, and states it is not a formal metric. Nothing in the table above produces it. It sits between the grounded tasks and the ungrounded ones, which is exactly where a number lands when it is an average of things that should not be averaged.
Method and limitations
- Sources were selected for being named, dated, and reporting a numeric rate. Where a source reported a range, both ends are shown; where it reported one figure, the range collapses to a point.
- No pooled average is published, deliberately. The six sources measure different quantities on different task sets. A median across them would carry false precision. The comparison is the deliverable.
- Each cell rests on a single study. This is a survey of what has been published, not a meta-analysis. Treat individual cells as one lab's finding, not a settled value.
- Three sources are cited via a secondary report — HALC-Bench via AIMultiple, Stanford RegLab via Seekr, Mount Sinai via Healthcare IT News. Where you need to quote a figure formally, go to the primary paper.
- Rates move as models ship. Vectara's figure is from November 2025 and the leaderboard updates regularly; AA-Omniscience is July 2026. Compiled 21 August 2026.
What to do with this if you are specifying a system
The practical read is that choosing a model is the smaller decision. Moving a task from ungrounded recall to grounded summarisation — by putting the right document in front of the model — moves you between rows of this table, and the rows are an order of magnitude apart. Model selection moves you within a row.
Second, decide what an error costs you before you look at any benchmark. A system where a wrong answer is caught by a human reviewer can tolerate the accuracy-maximising model. A system where a wrong answer goes to a customer or into a filing wants the abstention-first one, and will rank the leaderboard differently. Those are different products, and the same hallucination rate means different things in each.
Frequently asked questions
What is the hallucination rate of large language models?
There is no single rate. Published figures run from 3.3% on document summarisation to 88% on legal queries, depending on the task and how it was measured. Grounded tasks, where the model has a source document in front of it, produce the low end. Ungrounded recall of precise facts produces the high end.
Which LLM hallucinates the least?
It depends on the task. On Vectara's summarisation leaderboard, Gemini-2.5-flash-lite led at 3.3% as of November 2025. On AA-Omniscience's knowledge benchmark, Claude Fable 5 led at index 40 in July 2026 — but on the strength of 61% accuracy rather than restraint, still fabricating 54.9% of the time when it answers without knowing, against Claude Opus 4.8's 35.9%.
Is the 30% hallucination rate figure accurate?
No. Lakera describes it as media shorthand for the idea that roughly 30% of AI outputs may contain errors, and states explicitly that it is not a formal metric. No benchmark in this comparison produces it.
Can prompting reduce hallucinations?
Substantially, on some tasks. HALC-Bench reported a long-context hallucination rate of 65.9% without mitigation prompting and 44.2% with structured mitigation prompting — 21.7 percentage points from prompt structure alone, with no change of model. That is larger than many model-to-model differences.
Why do medical and legal LLM hallucination rates look so high?
Both require precise, verifiable facts recalled without a source document, and both have large volumes of plausible-sounding wrong answers in training data. Stanford RegLab reported 69–88% on legal queries; a Mount Sinai comparison of six models found the worst performer at 80.0% on long clinical cases and 82.7% on short ones. A 2024 study of citation retrieval found 86.6% to 100% of cited papers were absent from the source reviews.
Related services
Related guides
Want a professional site without the agency invoice?
Tell us about your project below and we'll reply within 24 hours with a clear, fixed quote, no surprises.
Prefer WhatsApp or email?