[ Data ] · 9 min read
How Many Data Centers Are Actually Being Built in Texas?
Texas is about to pass Virginia as the world's largest data center market, and the numbers used to describe it are wildly inconsistent because they measure different things. Here is the pipeline stage by stage, with the ratio that matters: 474 GW queued against 6.5 GW under construction.
Key takeaways
- 140 data center and technology infrastructure projects are in active construction in Texas, out of more than 250 registered — about 6.5 GW of capacity, the most in North America (Texas Contractor, Houston Public Media).
- ERCOT's large-load interconnection queue holds roughly 474 GW across more than 1,800 requests, about 90% of it data centers (Holland & Knight, Utility Dive).
- For every 1 MW of data center capacity physically under construction in Texas, about 73 MW sit in the interconnection queue. That ratio, 72.9 to 1, is the clearest single measure of how speculative the queue is, and it is why the state ordered an audit.
- The queue is 5.2 times the entire Texas grid's all-time peak demand of 91.1 GW, set on 22 July 2026 (US EIA). It grew 7.5-fold in twelve months, from 63 GW in August 2025.
- Roughly 49.8 GW is flagged at risk of delay by the August 2026 interconnection pause — about 20% of the entire US data center pipeline (BloombergNEF via Construction Dive).
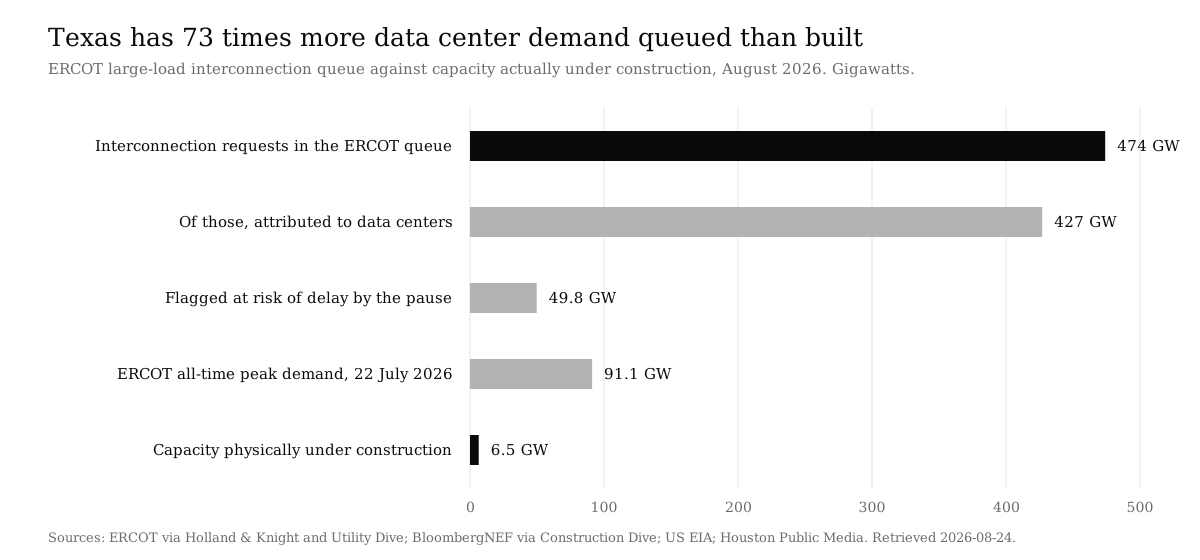
140 of the 250-plus registered data center and technology infrastructure projects in Texas are in active construction, representing roughly 6.5 GW of capacity — while ERCOT's interconnection queue holds about 474 GW. For every megawatt physically being built, roughly 73 megawatts are queued. That ratio is the number to carry away, because almost every confusing thing written about the Texas data center boom comes from mixing those two figures up.
Texas is on track to become the world's largest data center market this year, passing Virginia, on a 63% increase in construction investment to $26 billion in direct spending (Texas Contractor). It also has more data center power capacity under construction than anywhere else in North America (Houston Public Media). Both of those are true, and neither of them means 474 GW is being built.
This page sets out the pipeline stage by stage, sourced and dated, with the derived ratios and the underlying dataset as a CSV. It exists because we needed these numbers to be straight for our own work with contractors, and could not find them assembled anywhere.
The pipeline, stage by stage
| Stage | Figure | Times ERCOT peak | Times capacity under construction |
|---|---|---|---|
| Large-load interconnection requests in the ERCOT queue | 474 GW | 5.20 | 72.9 |
| Of those, attributed to data centers (about 90%) | 427 GW | 4.69 | 65.7 |
| Flagged at risk of delay by the August 2026 pause | 49.8 GW | 0.55 | 7.7 |
| ERCOT all-time peak demand actually served | 91.1 GW | 1.00 | 14.0 |
| Data center capacity physically under construction | 6.5 GW | 0.07 | 1.0 |
Read down the last column. The queue is not a pipeline in any construction sense of the word. It is a list of requests, and the list is 73 times larger than the thing being built.
Why the queue number is not a forecast
The 474 GW figure gets quoted as though it describes buildings. It does not. It counts interconnection requests, and a request is cheap relative to a data center. Three things inflate it.
The same project filed at several sites. A developer choosing between four locations files at all four, then builds at most one. Senate Bill 6's transparency requirements specifically direct the PUCT to make large-load customers disclose whether they have multiple similar interconnection requests under review in Texas, which tells you how well understood this problem is.
Position-holding. A queue with multi-year study timelines rewards filing early and deciding later, so filings run ahead of financing.
Projects with nothing behind them. This is what Governor Abbott's 3 August 2026 audit directive is designed to surface: whether a project brings its own generation, what water it uses, and whether it is claiming incentives. The Texas Tribune reported that up to 300 projects fall within the audit's scope.
There is a second, sharper way to see the inflation. BloombergNEF put 49.8 GW at risk from the Texas pause and described that as about 20% of the US data center pipeline (Construction Dive). Work backwards from those two numbers and BNEF's implied figure for the entire US pipeline is roughly 249 GW. Texas's data center queue alone, at about 427 GW, is 1.7 times the whole country's pipeline. A single state's request list cannot exceed the national build. The gap is the measure of how much of the queue is not real.
How the queue grew: 63 GW to 474 GW in twelve months
| As of | Queue | Times August 2025 | Times ERCOT peak | Reported by |
|---|---|---|---|---|
| August 2025 | 63 GW | 1.00 | 0.69 | Latitude Media |
| February 2026 | 226 GW | 3.59 | 2.48 | Latitude Media |
| June 2026 | 438 GW | 6.95 | 4.81 | Utility Dive |
| August 2026 | 474 GW | 7.52 | 5.20 | Holland & Knight |
A 7.5-fold increase in a year is not demand growth. Demand does not do that. It is the signature of a queue that costs almost nothing to join, which is the condition the SB6 rulemaking and the audit are both responses to. Sources: Latitude Media, Utility Dive, Holland & Knight. Dataset: ercot-large-load-queue-growth.csv.
One more derived figure worth having: 474 GW spread across more than 1,800 requests averages about 263 MW per request. That is a large campus each. It is another way of seeing that the queue is describing an implausible country's worth of construction inside one state.
Where the projects actually are
The concentration is unusual and it is not where most people assume. By registered value, the leader is not a major metro (Texas Tribune, Houston Public Media).
| County | Registered value | Note |
|---|---|---|
| Taylor (Abilene) | About $13.4 billion | The largest single concentration in the state |
| Shackelford | About $10.6 billion | Vantage filed ten Project Frontier buildings in June 2026 |
| Dallas, Tarrant, Ellis | DFW metroplex | Next by registered value, spread across three counties |
Two rural West Texas counties hold roughly $24 billion of registered value between them. For a contractor that matters more than the headline state figure, because it says the labour, lodging and logistics problem is concentrated where there is least of all three, and that the DFW work is spread across three counties rather than sitting in one place.
What the money looks like per project
Set the $26 billion of 2026 direct construction spending against the 140 projects in active construction and you get roughly $186 million of 2026 spend per active project. Treat that as an order of magnitude rather than a budget: the $26 billion covers technology infrastructure broadly, spending is not evenly distributed, and a single hyperscale campus can carry more than the average by an order of magnitude on its own.
The more useful derived figure is the split. Of the 250-plus registered projects, 140 are in active construction and about 110 are not yet building. That 44% is the cohort the interconnection pause actually bites, because those are the projects least likely to hold a completed interconnection study and an executed agreement. We work through that test in does the Texas data center pause stop construction on my project.
Using and citing these figures
The two CSVs are free to use with attribution to Inferya and a link to this page. The derived columns are the reason they exist, so if you take a ratio please take it with its denominator: 72.9 to 1 is queue against capacity under construction, not against anything else.
- texas-data-center-pipeline.csv — each stage with its value, unit, as-of date, source and both derived multiples.
- ercot-large-load-queue-growth.csv — the twelve-month queue series with growth multiples.
- texas-data-center-pipeline.svg — the chart above.
Sources and method
- Queue size and composition: ERCOT figures of roughly 474 GW across more than 1,800 large-load requests, about 90% data centers, as reported by Holland & Knight and Utility Dive, August 2026. Earlier points in the series from Latitude Media and Utility Dive. Retrieved 24 August 2026.
- Projects and capacity under construction: more than 250 registered projects with 140 in active construction, and $26 billion of 2026 direct spending on a 63% increase, from Texas Contractor; more than 6.5 GW under construction from Houston Public Media. Retrieved 24 August 2026.
- County concentration: Texas Tribune and Houston Public Media, June 2026, retrieved 24 August 2026.
- Delay exposure: BloombergNEF via Construction Dive; audit scope of up to 300 projects from the Texas Tribune. Retrieved 24 August 2026.
- Peak demand: US Energy Information Administration, 91.1 GW on 22 July 2026, 6% above the previous record of 85.5 GW set on 10 August 2023. Retrieved 24 August 2026.
- Derived figures are ours and are plain arithmetic on the sourced values above: the 72.9 to 1 ratio, the 5.20 and 4.69 multiples of peak demand, the 7.52-fold twelve-month growth, the 263 MW average request, the implied US pipeline of about 249 GW, the roughly $186 million per active project, and the 110 pre-construction projects. The build script that produces both CSVs is in the repository alongside this site.
- Known limitations. The queue series mixes reporting vintages and the intermediate points are approximate. Capacity under construction and queue volume measure different things — built megawatts against requested load — so the 72.9 ratio is a comparison of two different quantities and is meaningful as a scale check, not as a conversion rate. Registered project value is not construction cost. This is an active regulatory situation; confirm current figures with ERCOT and the PUCT before relying on them.
The next step
If you are a contractor trying to work out how much of your own backlog is in the 6.5 GW and how much is in the 474 GW, that is the right question and it is answerable per job. We wrote the test out in does the Texas data center pause stop construction on my project, and the concentration-risk version in where do Texas contractors find work if data center projects slip.
If the harder problem is that you cannot see your own pipeline clearly enough to run that test, that is what we build. Tell us what you cannot see, or read what AI automation and custom software development actually cover.
Frequently asked questions
How many data centers are being built in Texas?
As of August 2026, 140 data center and technology infrastructure projects are in active construction in Texas, out of more than 250 registered projects, representing roughly 6.5 GW of capacity. That is the most data center capacity under construction anywhere in North America.
How big is the ERCOT data center interconnection queue?
ERCOT is tracking more than 1,800 large-load interconnection requests totalling roughly 474 GW as of August 2026, of which about 90%, or 427 GW, is attributed to data centers. That is 5.2 times ERCOT's all-time peak demand of 91.1 GW.
Why is the ERCOT queue so much bigger than what is being built?
Because a queue position is cheap relative to a data center. The same project is often filed at several candidate sites, developers file early to hold position while financing is arranged, and some filings have no capital behind them at all. Senate Bill 6 directs the PUCT to require disclosure of duplicate requests for exactly this reason, and the August 2026 audit is intended to identify which projects are real.
Is Texas the largest data center market in the world?
Texas is on track to pass Virginia and become the largest data center market this year, on a 63% increase in construction investment reaching $26 billion in direct spending in 2026, according to Texas Contractor.
Where in Texas are the data centers being built?
By registered project value the leader is Taylor County around Abilene, at roughly $13.4 billion, followed by Shackelford County at about $10.6 billion where Vantage filed ten Project Frontier buildings in June 2026. The DFW counties of Dallas, Tarrant and Ellis follow. The two largest concentrations are rural West Texas counties rather than major metros.
How much Texas data center capacity is at risk from the interconnection pause?
BloombergNEF estimates roughly 49.8 GW is at risk of delay, which it describes as about 20% of the US data center pipeline, with Central Texas the most concentrated area of exposure. Separately, about 110 of the 250-plus registered Texas projects are not yet in construction and are the cohort most exposed.
Related services
Related guides
Want a professional site without the agency invoice?
Tell us about your project below and we'll reply within 24 hours with a clear, fixed quote, no surprises.
Prefer WhatsApp or email?